ARLINGTON — Recent visitors to the city of Arlington’s website, at http://arlingtonwa.gov, might have noticed a new feature on its “Maps and Data” page, one which city employees hope will help make citizens safer and more informed.
The two-week PDF crime maps on that webpage represent the culmination of plans that began with Val Copeland of the Arlington Police Department and city of Arlington Geographic Information Systems Coordinator Katie Kelleher in 2007.
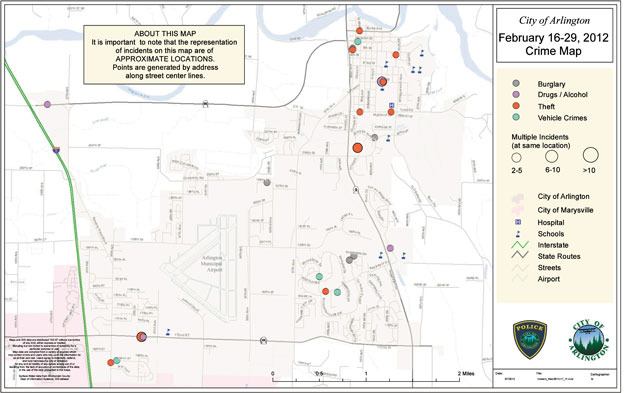
“Crime pin maps are typically shown in movies as a large map on the wall with pins at crime locations, so that the detectives can follow hot spots of criminal activity as well as track specific crimes,” city of Arlington Public Works Director Jim Kelly said. “Electronic crime maps are generated with databases and are even more useful, as they show criminal activity by date, type or location, providing the police with an effective way to manage resources and to deter crime.”
Kelleher explained that, because Arlington’s GIS group was new to crime mapping in 2007, they started by visiting Doug Lindsey of the Everett Police Department, to learn how Everett implemented its own crime mapping. Kelleher credited her own visits to the Everett Police Department, where she studied their system of tracking crimes, with helping to get Arlington’s GIS crime maps on the right path.
Kelleher also cited Lindsey’s suggestion that the city of Arlington use what’s known as the geocode tool to allow GIS technicians to place address points at specific locations. For crime mapping, this tool takes a table of addresses and places them on the correct blocks of specific streets, usually within 100 feet of the actual addresses. Once these crimes are placed correctly on maps, they’re also stored in a database for easy access and analysis.
Arlington’s GIS group took a couple of months to input the street address ranges into the geocode tool. According to Kelleher, what made Arlington’s crime maps so successful was that the Arlington Police Department provided properly formatted crime addresses so that the geocode tool was able to work to its maximum efficiency.
Since 2007, in addition to mapping crimes, the city of Arlington has used the geocode tool to map utility meters, plat addresses and businesses, which Kelleher sees as increasing the productivity of Arlington’s GIS group while also providing valuable services to a variety of city departments.
Because the electronic crime database goes back to 2007, it furnishes city staff with reliable datasets for analysis and mapping. The database has grown further by adding traffic accidents going back to 2004.
“This database is useful for the city of Arlington Police and Engineering departments, to assist with transportation to make the city safer and easier for citizens to get around town,” Kelleher said.
The city recently made two-week PDF versions of those crime maps available on its website, to let citizens know where crime activity has occurred, and even to allow them to follow the crime activity or see the changes in crime over time.
“We don’t show the specific residences or businesses where those crimes have occurred,” Kelleher said. “But it gives citizens an idea of where certain types of crime are occurring, and also shows that our crime rate is very low compared to other cities.”